Sunspot Cycle: Difference between revisions
(added external link) |
(corrected sentence error) |
||
| Line 9: | Line 9: | ||
==Why are the sunspot cycles numbered?== | ==Why are the sunspot cycles numbered?== | ||
The written evidence of sunspot observations | The first written evidence of sunspot observations are from around 800BC in China. The first telescopic observations of the sun started in the 1600's, with the cyclic nature of sunspot activity being described by Samuel Schwabe in 1843. We are now (2009) at the start of a new sunspot cycle. | ||
==How do sunspots affect [[Propagation | propagation]]?== | ==How do sunspots affect [[Propagation | propagation]]?== | ||
Revision as of 15:14, 3 November 2010
What is it?
The sunspot cycle is generally known to be a cycle of approximately 11 years between successive peaks in sunspot activity.
What is less known and understood is that with each successive 11 year peak, the magnetic field of the sunspots is reversed. So the sunspot cycle is in reality a 22 year cycle when the magnetic fields of the sunspots are taken into account.
On January 4th 2008, the first recent "reverse polarity" sunspot was recorded. This officially marked the start of sunspot cycle 24.
Why are the sunspot cycles numbered?
The first written evidence of sunspot observations are from around 800BC in China. The first telescopic observations of the sun started in the 1600's, with the cyclic nature of sunspot activity being described by Samuel Schwabe in 1843. We are now (2009) at the start of a new sunspot cycle.
How do sunspots affect propagation?
Most shortwave radio users know that there is a correlation between sunspots and propagation conditions. Sunspots are dark regions on the surface of the Sun, which are cooler than surrounding areas. They occur when the lines of the Sun's magnetic field become twisted. There are more sunspots when the Sun is more active, and produces more radiation which can affect the Earth's ionosphere.
The F layer of the ionosphere is caused mostly by ultraviolet radiation from the Sun. During times of high solar activity, there is more radiation from the Sun, and the resulting higher ionization levels in the F layer allow higher frequencies to be reflected. For example, around solar maximum, the 10 meter band (28 to 30 MHz) is frequently open for extended periods of time, and long distances can be worked with rather low power levels.
The D layer is also ionized more during the solar maximum, resulting in more attenuation, especially at the lower frequencies.
External link Radiowave propagation center
What is the solar flux?
Solar flux measures the radiation signal strength at 2800 MHz (10.7 cm wavelength ) There is a rough relationship between the signal strength and the number of sunspots. As the sunspot number (SSN) varies from 0 around 200, the solar flux varies from around 60 to 300.
How is sunspot activity predicted?
NASA uses a number of methods for predicting sunspot activity. At the minimum of a cycle there are relationships between the size of the next cycle maximum and the length of the previous cycle, the level of activity at sunspot minimum, and the size of the previous cycle.
Among the most reliable techniques are those that use the measurements of changes in the Earth's magnetic field at, and before, sunspot minimum. These changes in the Earth's magnetic field are known to be caused by solar storms but the precise connections between them and future solar activity levels is still uncertain.
In 1993 Richard Thompson found a relationship between the number of days during a sunspot cycle in which the geomagnetic field was "disturbed" and the amplitude of the next sunspot maximum. This method has the advantage of giving a prediction for the size of the next sunspot maximum well before sunspot minimum.
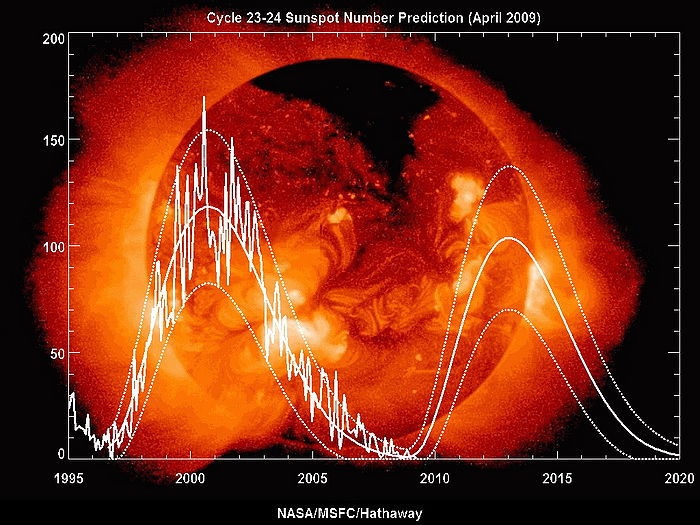
NASA uses a combination of prediction techniques, and has produced the following graphic that shows the range within which the next sunspot cycle will be.
Why is there variatiion in the sunspot cycle?
Information is taken from the Science@NASA newsletter website.
June 17, 2009: The sun is in the pits of a century-class solar minimum, and sunspots have been puzzlingly scarce for more than two years. Now, for the first time, solar physicists might understand why.
At an American Astronomical Society press conference today in Boulder, Colorado, researchers announced that a jet stream deep inside the sun is migrating slower than usual through the star's interior, giving rise to the current lack of sunspots.
Rachel Howe and Frank Hill of the National Solar Observatory (NSO) in Tucson, Arizona, used a technique called helioseismology to detect and track the jet stream down to depths of 7,000 km below the surface of the sun. The sun generates new jet streams near its poles every 11 years, they explained to a room full of reporters and fellow scientists. The streams migrate slowly from the poles to the equator and when a jet stream reaches the critical latitude of 22 degrees, new-cycle sunspots begin to appear.
Howe and Hill found that the stream associated with the next solar cycle has moved sluggishly, taking three years to cover a 10 degree range in latitude compared to only two years for the previous solar cycle.
The jet stream is now, finally, reaching the critical latitude, heralding a return of solar activity in the months and years ahead.
| Propagation and radio wave theory | |
| Propagation | Aurora * E-Skip * IPS * Lightning scatter * Meteor scatter * Satellites * Trans-Equatorial Propagation * Tropospheric ducting |
| Interference | QRM * QRN |
| Theory | Electromagnetic Waves * Frequency Wavelength and Period |
